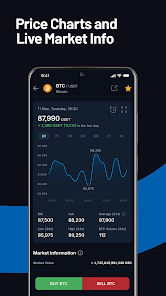
The bitcoin price you see on BtcTurk is not a number the exchange copies from somewhere else or simply "sets" on its own. That price is formed in the platform's own order book, at the point where users placing buy orders meet users placing sell orders. In other words, a BtcTurk price is a snapshot of the supply and demand of BtcTurk's own users at that exact minute — nothing more, nothing less.
In practice you need to tell three different numbers apart. The last price is the price of the most recent executed trade; it is the big number every screen displays. The best bid is the highest price a buyer is currently willing to pay, and the best ask is the lowest price a seller is currently willing to accept. The gap between the two is the spread. Add the 24-hour high, low and trading volume, and you can roughly read the day's story for any trading pair.
One thing up front: this page is an independent guide. We do not display live prices, we have no affiliation with BtcTurk, and we are not telling anyone to buy or sell anything. Our goal is to show, through the eyes of someone who has been poking around the plumbing of these markets since 2017, how a price actually comes into existence and what the numbers on the screen really say. For the broader picture of what BtcTurk is, see /en/btcturk-nedir/; for our take on the platform's trustworthiness, see /en/btcturk-guvenilir-mi/.
Why the TRY price on BtcTurk differs from the USD price on Google
This is the single most common question. When you google "bitcoin price", the number you get is usually a US dollar figure aggregated from global exchanges. On BtcTurk you are looking at the BTC/TRY pair — a price denominated in Turkish lira. To compare the two you first have to put the USD/TRY exchange rate in between. The rough formula: TRY price ≈ global USD price × USD/TRY rate ± a local premium or discount.
That "±" is where things get interesting. Because the BtcTurk price forms in its own order book, the TRY price drifts slightly above the theoretical value when Turkish demand is stronger than the global average (a premium) and slightly below it when demand is weak (a discount). Market people call this the currency effect plus a local premium. In periods of lira volatility or surging local demand, that gap can widen noticeably. A BtcTurk price deviating from Google is therefore not a glitch — it is an honest reflection of local supply and demand.
| Item | Illustrative value |
|---|---|
| Global BTC price (USD) | 100,000 USD |
| USD/TRY exchange rate | 40.00 TRY |
| Theoretical BTC/TRY equivalent | 4,000,000 TRY |
| Price formed in the BtcTurk order book (example) | 4,020,000 TRY |
| Local premium | roughly 0.5 percent |
There are also measurement differences: the number Google shows may be an index lagging by a few seconds, while the BtcTurk screen shows the last trade in its own book. Expecting the two figures to match tick for tick during a volatile moment is like expecting two wristwatches to agree to the millisecond.
The main TRY pairs: BTC/TRY, ETH/TRY and USDT/TRY
According to CoinGecko data from July 2026, BtcTurk lists roughly 184 coins across roughly 369 trading pairs, a large share of them quoted in TRY or USDT. But the volume and the attention concentrate on three pairs.
BTC/TRY: the flagship of the market
BTC/TRY is one of the deepest venues where a lira-denominated bitcoin price is formed. Because its depth is comparatively high, the spread is usually tight — the gap between buying and selling is small. When bitcoin's global dollar price and the USD/TRY rate move at the same time, BTC/TRY behaves like a twin-engine aircraft: sometimes both engines push in the same direction and the lira price moves sharply, sometimes one partially offsets the other.
ETH/TRY: the second heavyweight with its own agenda
ETH/TRY works on the same logic, but Ethereum's own news cycle — network upgrades, staking dynamics, ecosystem developments — feeds into the price as an extra input. Reading ETH/TRY means keeping three things in your head at once: the global ETH/USD trend, the exchange rate, and local demand. Depth is somewhat thinner than in the BTC pair, so larger orders carry a higher risk of slippage.
USDT/TRY: the unofficial currency thermometer
USDT/TRY may be the most instructive pair of all. Since Tether is designed to track one US dollar, the USDT/TRY price should hover very close to the USD/TRY rate. In practice, USDT usually trades at a modest premium to the official rate. The economics are simple: demand for access to digital dollars is high, while moving foreign currency through banking channels is slow and full of friction. People are willing to pay a small premium to route around that friction.
If the gap between the USDT/TRY price and the official USD/TRY rate suddenly widens, that is usually a sign of market stress: lira volatility, a demand surge, or congestion in transfer channels. Watching this gap like an early-warning thermometer will not give you a trading signal, but it does let you feel the market's pulse.
Reading the chart like an adult: candles, volume, intervals
The charts in BtcTurk's web and mobile apps run on TradingView infrastructure and use the classic candlestick format. Each candle summarizes four data points for the interval you select: open, close, high and low. The body shows the open-to-close range, the wicks show the extremes. A green candle means the close was above the open, a red candle means the opposite — that is all; there is nothing mystical about candles.
Intervals range from 1 minute to 1 month. One-minute candles show you market noise; daily and weekly candles show you the underlying trend. The volume bars beneath the chart show how much changed hands in each candle: moves backed by volume are considered more "real" than moves on thin volume. On the TradingView side you can also add moving averages, RSI and other indicators.
Indicators summarize the past; they do not report from the future. No combination of indicators can tell you tomorrow's price. Think of chart reading as weather forecasting: you see probabilities, never certainties. No chart interpretation — from this page or anywhere else — constitutes investment advice.
Order book and depth: bid, ask and spread, bazaar-style
The most honest way to explain an order book is a neighbourhood bazaar. You want to buy tomatoes; buyers are queued up saying "I will pay at most 40 lira a kilo" while sellers have set up stalls saying "I will not go below 42". The most generous buyer's price is the bid, the most reasonable seller's price is the ask, and the 2-lira gap between them is the spread. When someone gets impatient and accepts the other side's price, a trade happens and the "last price" updates. (These numbers are entirely illustrative.)
Market depth shows how much inventory is waiting at each price level. In a deep book, even a fairly large order barely nudges the price; in a shallow book, the same order pushes the price through several levels. The depth chart is the visual answer to the question "if I dropped a large order into this pair, how far would the price slip?" In flagship pairs like BTC/TRY, depth is generally satisfying; in the low-volume altcoin pairs at the tail of the list, spreads widen and depth thins out.
- Tight spread plus deep book: a liquid market with low transaction costs.
- Wide spread plus shallow book: every market order quietly bills you a hidden cost.
- Thick one-sided walls: large resting orders can be cancelled at any moment; a wall on the screen is not a commitment.
How to set a price alert
Instead of standing guard in front of a screen, it is far healthier to use the price alert feature in the official BtcTurk app. The logic is simple: pick a pair and a threshold price, and you get a notification when the price touches that level.
- Open the app. Sign in to the official BtcTurk mobile app or web interface; alerts are tied to your account, so a login is required.
- Pick the pair. Go to the detail screen of, say, BTC/TRY and find the alert (bell) icon.
- Set the threshold. Choose the condition — "if the price rises above" or "falls below" a level — and enter your target number. That number is entirely your own scenario; do not copy anyone else's target price.
- Test the notification. Make sure notification permissions are enabled on your phone; with permissions off, the alert dies silently.
- Treat alerts as reminders. When an alert fires, no trade is executed automatically; you are merely informed. The decision and the responsibility stay with you.
Why the easy-mode price and the Pro price are not the same
BtcTurk runs two storefronts. The simple buy/sell screen ("Basit Al/Sat") shows you a single quoted price: a packaged number with the spread and a service margin baked in, saying "you can buy right now at this price". The Pro interface shows you the naked order book: bid, ask, depth, recent trades. At the same second, the buy price on the easy screen will look slightly higher than the best ask in Pro — that is not a trick, it is convenience being priced.
For small, occasional trades the difference is negligible for most users; for frequent or large trades it compounds into a real cost line over time. We break down the fee schedule, spread costs and the maker/taker distinction in detail on the /en/btcturk-komisyon/ page — anyone learning to read prices should read that one too.
Volatility and risk: these numbers move fast
Crypto asset prices can fall or rise by double-digit percentages within a single day. Nothing on this page is investment advice; past price behaviour is no guarantee of future results. Only trade with money you can afford to lose, and never open a position without doing your own research.
Volatility is not a side effect of the crypto market; it is its nature. The same volatility is the raw material of both the opportunity stories and the horror stories. Keep that in mind whenever you look at a price screen: the number you see may be meaningfully different an hour later. That is exactly why this guide does not quote a single "current" price — it would be stale the moment we typed it. Live data is the official platform's job; our job is teaching you how to read it.
Five forces that move the TRY pairs
Carrying a mental checklist makes it much easier to understand why the numbers move. Behind almost every sharp move on a BTC/TRY or ETH/TRY chart you will find at least one of the following five sources — and often several working at once.
- The global dollar price: bitcoin's USD price on international venues is the main engine; a move there reaches the TRY pair within minutes.
- The USD/TRY rate: even if crypto stands still, a moving exchange rate changes the lira price — which is why BTC/TRY sometimes rises or falls "without any bitcoin news".
- Local supply and demand: the buying or selling appetite of users in Turkey at that moment sets the premium or discount.
- Liquidity and depth: in a thin book the same order size produces a much bigger price move; the effect is most visible overnight and in low-volume altcoin pairs.
- News and expectations: regulatory headlines, macro data and global risk appetite can hit both the exchange rate and crypto demand at once, amplifying moves.
Memorizing this list will not let you predict prices — nothing will — but it dramatically lowers the odds of seeing a move as "inexplicable" and panicking. That is what market literacy actually is: not knowing the future, but naming the present correctly.
The arbitrage reality check: money in theory, friction in practice
Gaps do appear from time to time between BtcTurk prices and prices on global venues, and arbitrage immediately comes to mind: buy where it is cheap, sell where it is expensive. Elegant on paper, full of friction in practice. Trading fees eat part of the gap; the price can turn against you during transfer times; network fees, deposit and withdrawal limits, and KYC procedures on both platforms squeeze whatever is left. Professional arbitrageurs run this business with millisecond infrastructure and large capital; a retail user rowing in the same race usually fails to cover even the costs.
Read this section as a cold shower, not an invitation: when you spot a price gap, you are not looking at free money — you are looking at a difference small enough, or expensive enough to move, that nobody has bothered to close it yet. And when a genuinely large gap does open up, the cause is usually congestion in the transfer channels — which is precisely the thing that makes the arbitrage impossible to execute.
Tracking prices without an account, and what requires a login
Good news: you do not need an account to watch BtcTurk prices. On the official web interface, the markets screen, the pairs, the charts and the order book are open to everyone. No identity verification is needed to sip your coffee and stare at the BTC/TRY chart.
Viewing live prices, exploring candlestick charts and time intervals, watching the order book and market depth, checking 24-hour volume and change data — all of this is possible on the official platform without signing in.
Setting price alerts, saving favourite pairs, placing orders and viewing a portfolio do require a login. For account creation, identity verification steps and secure sign-in settings (including two-factor authentication), see our /en/btcturk-giris/ guide. And the overall map of this site lives on the /en/ page.
For those who want a global reference point
One healthy way to read the TRY pairs is to keep a global dollar market open as a reference: what is BTC/USD doing over there, how far has USDT/TRY drifted from the official rate, has a local premium opened up? For this comparison, some people use an internationally regulated global trading platform as a second screen. That is not a necessity but an enrichment of perspective: seeing the same asset in two different order books is the fastest lesson that "the price" is never one single correct number.
OUR INDEPENDENT VERDICT
BtcTurk prices form transparently in the order book of a platform that has operated since 2013, claims more than 5 million users according to company statements, and now works under Turkey's capital-markets regulation (Law No. 7518 and the CMB communiqués III-35/B.1–B.2). A TRY price deviating from the global dollar price is not a flaw; it is the natural product of the currency effect and local supply and demand. Price literacy boils down to three habits: understand the order book, watch the USDT/TRY gap like a thermometer, and always account for spread costs. Check live data only on the official platform — and keep your distance from anyone selling predictions.
Frequently Asked Questions
Why is the bitcoin price on BtcTurk different from the price on Google?
Google typically shows a dollar-based index aggregated from global exchanges, while BtcTurk shows a Turkish lira price formed in its own order book. The difference comes from the USD/TRY exchange rate plus a local premium or discount. In periods of strong demand or lira volatility this gap can widen. The deviation is not an error — it is the natural result of two separate markets and two separate currencies.
Why does USDT trade above the official dollar rate on BtcTurk?
USDT/TRY usually trades at a slight premium to the official USD/TRY rate. The reason is that demand for access to digital dollars is high while moving foreign currency through banks is slow and full of friction, so users pay a small premium for convenience. A sudden widening of the gap usually signals market stress. For spread and trading costs, see our fees guide.
Where can I see live BtcTurk prices?
Live prices are displayed only on the official BtcTurk platform — the web interface (kripto.btcturk.com) and the mobile app. The markets screen, charts and order book can be viewed without an account. This site is an independent guide and does not publish live prices; every number you see here is illustrative. Personalized features such as price alerts require signing in on the official platform.
How do I read the BtcTurk chart?
The charts are TradingView-powered candlestick charts. Each candle summarizes the open, close, high and low for the selected interval; a green candle closed higher than it opened, a red one lower. Intervals run from 1 minute to 1 month, and the volume bars underneath show the strength behind each move. Indicators summarize the past, they promise nothing about the future — no chart reading is investment advice.
How do I set a price alert on BtcTurk?
Sign in to the official app, open the detail screen of the pair you want to watch and tap the alert (bell) icon. Choose the condition — price rising above or falling below a level — and enter your target; make sure notifications are enabled on your phone. Alerts only notify you, they never trade automatically. Our login guide covers sign-in and account security step by step.
Are BtcTurk prices reliable?
Prices form in the platform's own order book from real buy and sell orders. BtcTurk has operated since 2013 and now works in Turkey's regulated era under Law No. 7518 and the CMB communiqués III-35/B.1–B.2. A deviation from the global average is not manipulation but local supply, demand and the currency effect at work. For our full trust assessment, read the reliability page.